
ESSA LEVEL III BACKED RESULTS
The math outcomes your board expects you to show.
-
District-wide analytics at a glance — performance by school, teacher, standard, and subgroup.
-
85%+ license utilization — vs. ~10% industry average. Your investment actually gets used.
- One platform, every level — from student practice to PLC collaboration to SIS integration.
Predict where you're headed.
Know where to focus today.
District math leaders are responsible for outcomes across every school, every grade, and every standard — often with limited visibility into where students actually are. Derivita's Blueprint Analysis changes that, tracking student readiness and standard coverage in real time so district admins, curriculum directors, principals, and PLCs always know which standards need attention and how prepared students are for end-of-course and statewide assessments.
No more waiting for test results to tell you what instruction should have addressed months earlier.
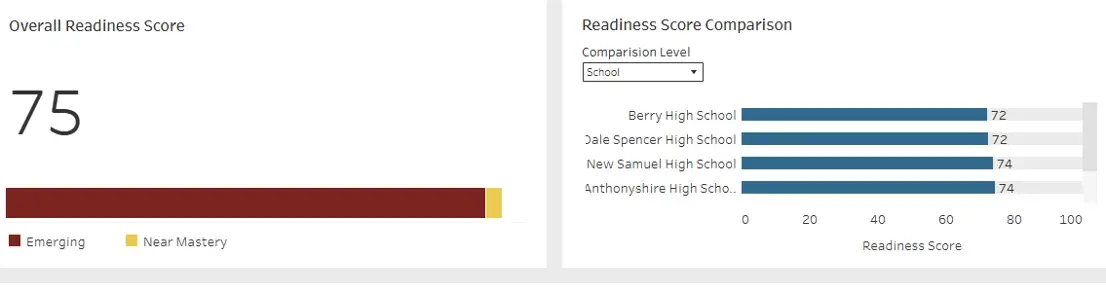
Derivita Readiness Score
The Readiness Score is a 0-100 score that helps educators understand how prepared a student is for all blueprint-aligned content (i.e. typically content that appears on a state test).
The Readiness Score is calculated based on quizzes, exams, checkpoints, and benchmarks (not including homework) and is mapped to all of the standards on a blueprint. The Readiness Score becomes more accurate as more standards are assessed across the year.
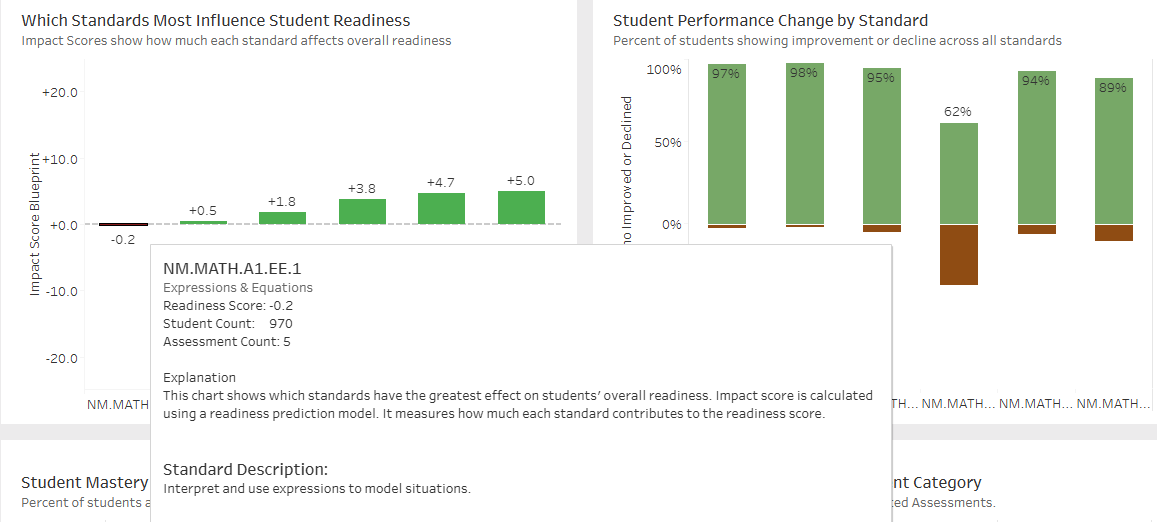
Derivita Impact Score
The Impact Score helps answer the question: "Which standards have the biggest effect on a student’s overall Readiness Score?"
While the Readiness Score tells us how ready a student is, the Impact Score tells us WHY — by breaking the Readiness Score down into specific standards that had a positive or negative contribution to a student’s Readiness Score.
-6f4e2319-1920w.webp?width=1920&height=1483&name=Untitled+design+(9)-6f4e2319-1920w.webp "District Analytics + SIS Integration")
Always know where every school stands.
Derivita's District Analytics give you a continuous, district-wide view of performance against state standards — across every school, teacher, subgroup, and cohort. Integrated directly with your SIS, it surfaces the data that matters most, when it matters most.
- Common assessments
- Demographic (subgroup) and cohort analytics
- Student performance across multiple schools
- Student performance against state standards
- School and teacher comparison reports
- PLC assessment reports
-6f4e2319-1920w.webp?width=560&height=433&name=Untitled+design+(9)-6f4e2319-1920w.webp "District Analytics + SIS Integration")
The Derivita District Model
Derivita's approach works at every level of your organization — from individual student practice to classroom instruction, PLC collaboration, school leadership, and district administration. The District Model white paper walks through exactly how it all connects.

What district leaders are saying
Check out how Jason Aldridge, District Math Specialist at Charleston County School District (CCSD) in South Carolina, expanded Derivita across his district — and what it meant for his schools.

School
Classroom
Student